Measuring the wavelengths of the visible lines in the Balmer
series
Method 2
Plug in and turn on the hydrogen discharge lamp.
Hydrogen gas is excited by a current flowing through the gas. Look
at the light emitted by the excited gas through your spectral glasses.
You will see the line spectrum of hydrogen.

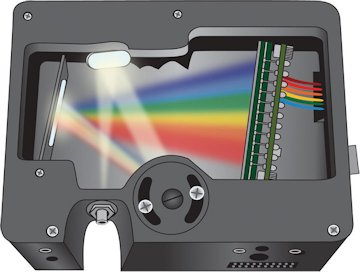
To measure the wavelengths of the spectral lines, connect the "Red Tide"
spectrometer to a USB port of your computer.

Make sure the Pasco 850 interface is turned on. Open
the Capstone program.
- Click Hardware Setup, and check that a picture of the "Red Tide"
spectrometer is displayed. This tells you that the spectrometer is recognized
by the program.
- Close Hardware setup and drag the "Graph" icon onto
the page. For the vertical axis choose intensity versus wavelength.
- Bring the fiber close to the lamp.
- Choose Continuous Mode, Fast Monitor Mode.
- Click the Monitor button and the the autoscaling
icon. Move the fiber until you see a nice spectrum.
The horizontal wavelength range will be 350 nm to 1000 nm, but only
data from ~400 nm to ~ 700 nm are meaningful, since the spectrometer
is limited to the visible region.
- When you are satisfied with your spectrum click stop.
- Add a coordinates tool. Drag it to each peak and record its wavelength.
You should see 4 peaks in the visible region with very different
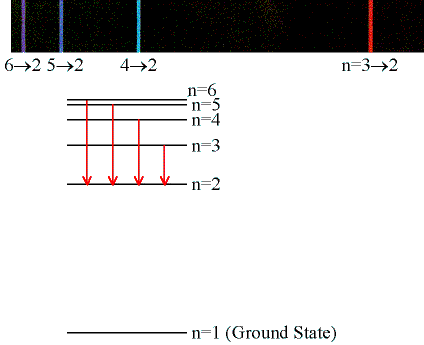
intensities. The peaks correspond to the 4 longest wavelength lines of the Balmer series. From ni
= 3, 4, 5, and 6 to nf = 2. Determine the wavelength of
each peak as accurately as possible.
Download the linked spreadsheet and enter each
wavelength in units of nm into the spreadsheet.
- Let column D contain 1/λ. Let column E contain (1/4 -
1/ni2). Into cell E2 type =1/4-1/A2^2 and copy
the formula into the other cells of the column.
- Plot 1/λ (y-axis) versus (1/4 - 1/ni2)
(x-axis). The slope of this graph should be the Rydberg constant R.
- Add a trendline to find the slope. Display the equation on the
chart and set the intercept to be zero. Format the trendline label,
scientific number format, with 3 decimal places. The slope is your
measured Rydberg constant in units of nm-1.
Paste your plot into your log.
- Calculate the value for R = 13.6 eV/(hc) with hc = 1240 eV nm and
compare your measured value with your calculated value. What is the
percent difference?
- Do you understand what you just did? If not, ask questions.


