
You will examine the fingerprint of the production of a top/anti-top quark pair that took place in the D-Zero detector at Fermilab on July 9, 1995. You will us the data analysis provided by the computer and conservation of momentum to calculate the mass of the top quark
Background information:
At Fermilab a top and an anti-top quark are created in the collision of a protons and an anti-proton. The highly energetic protons collide to create top quarks of about 180 times the mass of the protons. The energy of the less massive protons is converted into the huge mass of the resultant top quarks.
If there were a macroscopic analog, it would be something like a collision of two pig-pong balls resulting in the production of two ball bearings of the same size, but considerably greater mass.

The energy E of a particle that is traveling with a speed close to the speed of light is given by the expression
E = (m2c4 + p2c2)1/2.
This expression for E gives the total energy of the particle, its rest energy plus its kinetic energy.
In the collision of the proton and the anti-proton the two particles annihilate and the total energy of the two particles is available to make a top/anti-top pair. Scientists at Fermilab first discovered the top quark in 1995 when they collided protons and anti-protons with energies of 900 GeV. Production took place in the D-Zero detector.

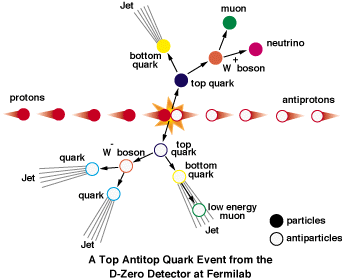
The top and anti-top quarks are very short-lived particles. They quickly decay into daughter particles and then in turn into "granddaughter" and "great granddaughter" particles. It is these "offspring" that are actually detected. The decay has a characteristic signature, as shown below.

The top and anti-top quarks are never directly detected because they decay rapidly into four "jets", a muon (green) and a neutrino (magenta). The data are analyzed by a computer. The computer identifies the expected jets of particles and calculates the energy and momentum associated with each jet. Since almost all the energy of the decay products is derived from the rest energy of the top/anti-top pair, finding the total energy of all the decay products and summing should yield the rest energy (and therefore mass) of the particles that have decayed.
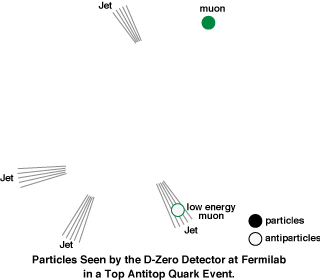
But the detector can only "see" the charged particles. It misses the neutrinos produced in the decay. The diagram below shows what the D-Zero detector actually sees.

To calculate the rest energy of the top/anti-top quark pair, we must first find the energy of the missing neutrino. This can be done using momentum conservation.
The incoming beams have no momentum transverse to the beam direction, so momentum conservation requires that the total momentum of the decay products transverse to the beam direction is zero. If we sum up all the transverse momenta of the detected particles by adding vectors, we can find the missing transverse momentum. This transverse momentum is equal to total missing momentum if the debris has no motion in the direction of the beams, which we define as the z-direction. The event must take place in a plane perpendicular to the axis of the proton and anti-proton beam, i.e. in the xy-plane. Fortunately the observed events were of this type.
The total energy available to produce all the debris is the rest mass of the top/anti-top pair, 2mtopc2. The computer calculates and displays the energy of the visible debris. Given this energy, how do we find the magnitude of the momentum?
Each particle has energy E = (m2c4 + p2c2)1/2. Fortunately the energy of each particle is much higher than its rest energy, so that E2- m2c4 ~ E2 and therefore E2 ~ p2c2, and we can write E = pc without making too much of an approximation. So given the energy in units GeV, we know the momentum in units of GeV/c and vice versa.
In this lab you will analyze computer generated plots of top/anti-top production events. You will analyze one simulated and one real event.

Projections of jets and muon tracks into the xy-plane are displayed. You will see blue and red "jets" and a solid green line which represents the muon track. You will also see a green dotted line, which is the track of a "soft muon" that is hidden in a jet. The events are displayed in two dimensions as they would be seen from the end of the detector.
Procedure:
Event 26 is a simulated event. Download the computer generated D-Zero detector end view of this event and open the file with Acrobat Reader. This will display a colored rendition of the black and white print-out.
Event 14022 is a real event. Download the computer generated D-Zero detector end view of this event and open the file with Acrobat Reader. This will display a colored rendition of the black and white print-out.
You can view another color plot of this event which shows how the debris could be mapped if the end view were unwrapped starting at the x-axis. This plot shows that indeed all the debris emerged nearly perpendicular to the z-axis.
Open Microsoft Word and prepare a report.
In your own words, state the objective of this laboratory exercise.
Insert your spreadsheet.
Discuss your results. In the discussion you should answer the following questions:
Which values did you obtain for the missing momentum?
Which values did you obtain for the mass of the top quark?
How do your values compare with the accepted value?
Add any comments or questions you may have.