So light is a wave, these experiments settle this? Not so fast!
In this laboratory you will perform an experiment that suggests that light is a particle. You will investigate the photoelectric effect. To eject an electron from a metal surface a certain amount of energy Φ, called the work function of the metal, must be supplied to this electron. (If no energy were required to free the electrons, they would just leave ordinary pieces of metal.) In the wave picture the energy of the light beam does not depend on the frequency, but only on the intensity, which is proportional to the square of the amplitude. Einstein explained the photoelectric effect by postulating that an electron can only receive the large amount of energy necessary to escape the metal from the EM wave by absorbing a single photon. If this photon has enough energy, the electron is freed. Excess energy appears as kinetic energy of the electron. The maximum kinetic energy of the electron is given by E = hf - Φ. If the photon does not have enough energy, then the electron cannot escape the metal.
In this laboratory you will direct yellow, green, blue, violet and ultraviolet light onto a metal surface and measure the kinetic energy of the photoelectrons ejected from the metal as a function of the frequency of the light used to eject the electrons. You will measure the work function of the metal and also determine the value of Planck's constant from your data.
Open a Microsoft Word document to keep a log of your experimental procedures, results and discussions. This log will become of your lab report. Address the points highlighted in blue. Answer all questions.
Exploration:
Before stating the experiment, work with an on-line simulation
from the University of Colorado PhET group.
Link to the simulation:
http://phet.colorado.edu/en/simulation/photoelectric
Click "Download" or "Run Now!".
Explore the interface. There are some non-obvious controls.
You can elect Show photons in the Options menu to show the light beam as composed of individual photons.
You can select Control photon number instead of intensity in the Options menu to change the Intensity slider to a Number of photons slider.
You can use the camera icon to take a snapshot of the graphs so that you can compare graphs for different settings.
You can Pause the simulation and then use Step to incrementally analyze.
For a Sodium target discuss:
For a fixed number of photons and zero battery voltage, how does the number of photoelectrons ejected depend on the wavelength? Does every photon eject an electron? Does the probability of ejection change with wavelength? Discuss!
For a fixed wavelength and zero battery voltage, how does the current depend on the light intensity? Discuss!
For a fixed wavelength and light intensity, how does the current depend on the battery voltage?
For a fixed wavelength and light intensity, do all ejected electrons have the same energy? How can you measure the maximum energy of the ejected electrons.
| Now try the other targets.
What is the longest wavelength (λmax) light can eject
electrons from those targets? What is the work function Φ = hc/λmax
of these targets? Complete the table and paste it into your log.
(Remember: hc = 1240 eV nm) |
|
Experiment:
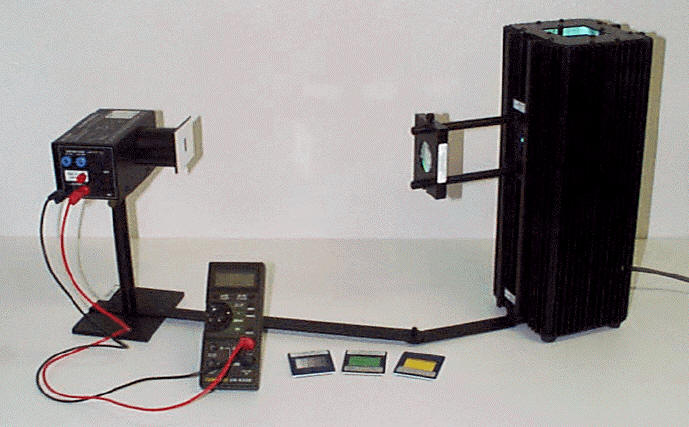
| The apparatus is shown on the
right.
The light source is a mercury vapor lamp. The mercury atoms produce strong emission lines at different frequencies or colors.
Photons of light of different colors are separated by a transmission grating that diffracts light of different colors into different directions. A lens focuses the light onto a photoelectric head, where the photons strike a metal cathode and eject electrons. The electrons are collected on the anode. In the simulation you just explored, the electrons flow back from the anode to the cathode through a wire, and the current in the wire is measured. In our experiment we do not connect the cathode and anode with a wire, but with a voltmeter. No current flows through an ideal voltmeter. The electrons cannot leave the anode.
|
|
||||||||||||||||||
| Electrons are negatively charged,
and as more and more electrons gather on the anode, the anode becomes
more and more negatively charged. A potential difference or
voltage develops between the cathode and the anode. The electrons
already collected on the anode repel electrons ejected from the cathode
at a later time. It is convenient to measure the electron energy
in units of electron volt (eV). In SI units 1 eV = 1.6*10-19J.
If the potential difference between the
cathode and anode has grown to x volts, then electrons ejected from the
cathode need an energy of at least x eV to overcome this potential
difference and to reach the anode. By
measuring the maximum voltage between cathode and anode, we can
determine the maximum energy of the electrons that reached the anode.
The maximum energy E of electrons that reached the anode in eV has the same numerical value as the maximum voltage in V. |
Schematic of the photoelectric head showing the cathode and anode. |
||||||||||||||||||
(a) Set up the apparatus as shown
in the figure above. The light source should have a slit assembly
mounted in place with a lens/grating assembly attached by two rods.
The grating should be mounted away from the
light source and should not be touched with
fingers in making any adjustments. Take a look at the apparatus
and identify the following pieces:
(b) Your mercury lamp should have been on at least 10 minutes to warm up. Rotate the photoelectric effect head on its swinging coupling bar so that the zeroth order of the diffraction grating strikes the white reflective mask on the front of the photoelectric head. If the light image doesn’t appear well focused, you can adjust the position of the lens/grating assembly; adjust it by loosening the thumbscrew and sliding it along its rods. |
|
||||||||||||||||||
|
(c) Roll the light shield out of the way to reveal the white photodiode mask inside the apparatus. You now need to rotate the photoelectric head on its support rod until the input light is passing through the input rectangular aperture and is striking the holes in front of the photodiode. Once you have it adjusted properly, tighten the thumbscrew in the base support rod. Unfortunately, even when this thumbscrew is tight the apparatus can still rotate a little bit, so you have to be careful not to bump it. You may also need to adjust the lens/grating assembly a bit to achieve the sharpest possible image of the aperture on the window in the photodiode mask. Then roll the light shield back into place. Whenever you move to a different wavelength of light, you need to open the light shield and recheck that the light is striking the phototube inside the apparatus. (d) Turn the power switch of the photoelectric head ON. Now rotate the entire photoelectric head about the pin in the coupler bar until you see the colored maxima in first order. Swing to either side of the zeroth order and figure out which side the first order maxima appears to be brighter on (it will be brighter on one side since this is a blazed diffraction grating). Make sure that you can identify all five spectral lines listed in the table below. (e) Pick out one of the lines in first order (on the bright side) and make sure it is striking the photodiode following the procedure in step (c). For the green and yellow lines you need to use the filters provided to limit other frequencies of light from entering the apparatus. Place the appropriate filter (green or yellow) on the white reflective mask. Press the “PUSH TO Zero” button on the side of the photoelectric head. This will discharge any charge built up on the anode. Release the button, and then look at the voltage on the voltmeter. You will see it immediately jump up to some non-zero value and then, depending on the light intensity, it may take a few (sometime as long as 30 – 40 seconds) to settle at its final value. The final, stable voltage value on the voltmeter is the stopping potential for that wavelength of light. Open Excel and prepare a table as shown to the right. Enter your measured maximum electron energy in eV for your chosen color into the table. |
|
Adjust the apparatus and position the head to measure the stopping voltage for each of the five colors listed in the table and enter the maximum electron energy into the table.
(f) Prepare a graph of the maximum electron energy versus
the frequency of the light. Choose a X-Y Scatter plot. Plot maximum
electron energy on the vertical axis and frequency on the horizontal axis.
Prediction: E = hf - Φ
This equation is of the form y = ax + b, with a being the slope and b being the
y-intercept. The slope of the plot of E versus f will yield Planck's
constant and the y-intercept will yield the work function of the metal cathode.
Add a trendline and insert the equation for the trendline into your plot.
Use the slope of your trendline to find Planck's constant h and the intercept
value to find the work function Φ of the photocathode material of the phototube.
If there are data points that seem to deviate to far from the trendline, repeat
those measurements until you are satisfied that you have done your best.
(e) Since the electron energy is measured in eV and the frequency in seconds, Planck's constant h will have units of eV s and the work function will have units of eV. Convert Planck's constant to SI units (J s) by multiplying the value you obtained from the slope by 1.6*10-19J/eV.
(g) Repeat all your measurements with dimmer lines from the second order pattern or from the first order pattern on the opposite side. Measure the maximum electron energy for these lines and compare with the values you previously obtained using the first-order, bright pattern.
Turn the power switch of the photoelectric head OFF.
Insert your tables obtained using the bright lines and the dimmer lines, respectively, into your log and comment on your results.
What value did you obtain for h in units of eV s and J s?
How does this value compare with the accepted value h = 6.626*10−34 J s = 4.136*10−15 eV s?
Describe the effect that different colors of light had on the stopping potential and thus the maximum energy of the photoelectrons.
Describe the effect that the different light intensity had on the stopping potential and thus the maximum energy of the photoelectrons. Do you see an effect? Did you expect an effect? Think about your measuring instrument. (No current flows through an ideal voltmeter. But a real digital voltmeter measures voltage by drawing a small amount of current. What can happen if the light intensity is low and few photoelectrons are ejected?)
Defend whether this experiment supports a wave or a quantum model of light based on your lab results.
Open Microsoft Word and prepare a report.
Convert your log into a lab report,