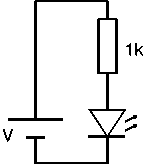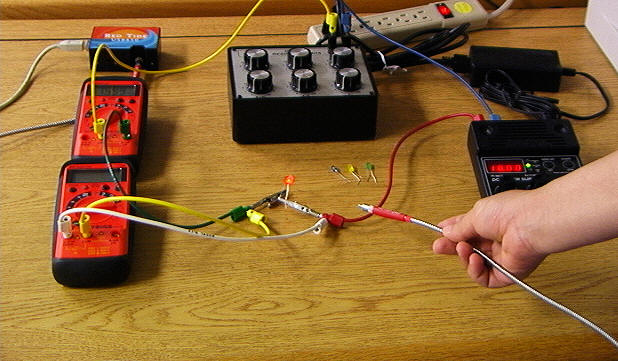

In this laboratory you will measure the voltage across several visible light-emitting diodes (LED's) as a function of the current flowing through the diodes. You will use your data to estimate the band gap of the semiconductor material the diode is made of and predict the wavelength of the emitted light. You will check their predictions by measuring the wavelength of the peak in the diodes emission spectrum with a "Red Tide" spectrometer.

Background information:
A light-emitting diode is a p-n junction rectifier. When p- and n-type semiconductors are brought together to form a p-n junction, electrons with energies in the conduction band diffuse from the n-side to the p-side and holes with energies in the valence band diffuse from the p-side to the n-side. Without an externally applied voltage, a diffusion potential VD is generated in the depletion layer between the n-type and the p-type material. The diffusion potential prevents more electrons and holes from leaving the n- and p-regions, respectively, and entering the opposite regions. When an external forward biased voltage V is applied, the potential barrier is reduced. When V ~ VD the height of the barrier is approximately zero and electrons can flow from the n-side to the p-side. Recombination of electrons and holes now can continue and a current will flow across the junction from the p-type to the n-type material. During the recombination energy is released. It can be released in the form of a photon with energy hf ~ Eg, where Eg is the width of the bad gap of the semiconductor.
If we measure the minimum voltage Vmin required to cause photon emission, and we measure the wavelength of the emitted photons and use it to calculate the photon energy hf, we always find that eVmin < hf. Some of the photon energy is supplied by thermal energy. In order to predict the wavelength of the photons emitted by a LED, we must take into account the distribution of charge carriers in the semiconductor material. The peak emission is expected at a photon energy somewhat higher than the Eg.
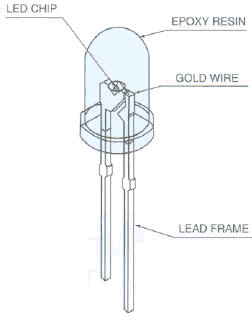
The anatomy of a common LED is shown below.

The circuit symbol is ![]() .
.
Forward bias requires that the voltage at the anode (a) of the LED
is positive with respect to the voltage at the cathode (k). The cathode has the
shorter lead.


The color of the plastic case around a LED chip does not always indicate the color of the emitted light.
Link: Interactive Java Tutorial: Light emitting diodes
Equipment needed
The table below lists the physical properties of typical LEDs.
|
|
Red Diode |
Yellow Diode |
Green Diode |
Blue Diode |
|
Wavelength (nm) |
665±15 |
590±15 |
560±15 |
460±15 |
|
Color |
Red |
Yellow |
Green |
Blue |
|
Composition |
GaAs.6P.4: N |
GaAs.15P.85: N |
GaP:N |
InGaN |
Procedure:


Quantum Dots
Since you have all the equipment out on the table, complete the Quantum Dots exercise.
Open Microsoft Word and prepare a report.
Summarize the experiment.
Insert your spreadsheet tables and discuss your results. In the discussion you should answer the following questions.
Which LED has the largest and which has the smallest band gap?
Which LED emits photons with the longest wavelength and which emits photon with the shortest wavelength?
Does your experiment reveal a connection between the band gap energy Eg and the photon energy hf? If yes, can you put this connection into the form of an equation?
Can you think of a way of designing an experiment using LEDs to measure Planck's constant h?
Show and briefly discuss the results of your quantum dots measurements.