
Objective:
In this laboratory you will study the emission of light from a hydrogen discharge source. You will measure the wavelengths of the visible lines in the Balmer series and and analyze your data to determine the Rydberg constant.
Background information:
When an electron changes from one energy level to another, the energy of the atom must change as well. It requires energy to promote an electron from one energy level to a higher one. This energy can be supplied by a photon whose energy E = hf = hc/λ.
Since the energy levels are quantized, only certain photon wavelengths can be absorbed. If a photon is absorbed, the electrons will be promoted to higher energy levels and will then fall back down into the lowest energy state (ground state) in a cascade of transitions. Each time the energy level of the electron changes, a photon will be emitted and the energy (wavelength) of the photon will be characteristic of the energy difference between the initial and final energy levels of the atom in the transition. The energy of the emitted photon is just the difference between the energy levels of the initial (ni) and final (nf) states.
The set of spectral lines for a given final state nf are generally close together. The lines for which nf = 2 are called the Balmer series and many of these spectral lines are visible. You will measure the wavelengths of the Balmer series lines in this laboratory.
The photon energies E = hf for the Balmer series lines are given by the formula
hf = -13.6 eV(1/ni2 - 1/22) = 13.6 eV(1/4 - 1/ni2).
We may write hc/λ = 13.6 eV(1/4 - 1/ni2), or
1/λ = (13.6 eV(/hc))(1/4 - 1/ni2) = R(1/4 - 1/ni2).
The constant R is called the Rydberg constant. Students will experimentally determine the Rydberg constant in SI units.
Equipment needed:
Hydrogen discharge lamp
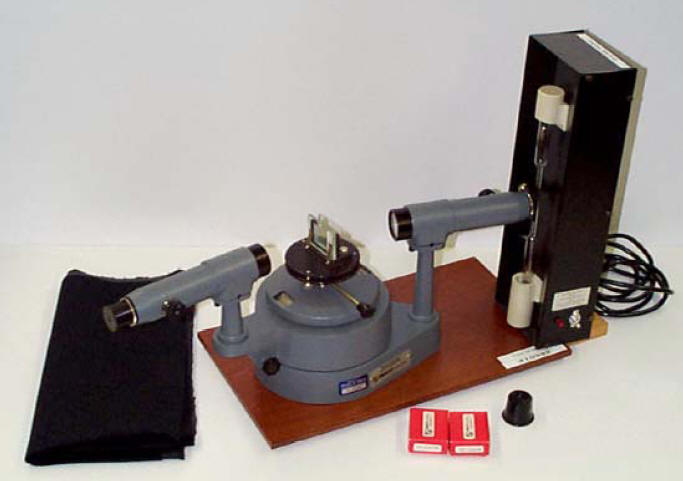
Pasco Model SP-9268 precision student spectrometer
a grating with 300 lines per mm
a black cloth to black out stray light
or
Ocean Optics Red Tide Spectrometer

Experiment:
We have two different experimental setups to measure the
wavelengths of the visible lines in the Balmer series.
Method 1: Using the Pasco Model SP-9268 precision student spectrometer
Method 2: Using the Ocean Optics Red Tide Spectrometer
Open Microsoft Word and prepare a report.
Summarize the experiment.
Insert your spreadsheet and discuss your results. In the discussion you should answer the following questions.
If you used method 1, do your values of θR and θL agree to within 0.01 rad?
Are your values of λ close to those that you would expect for the wavelengths of the lines in the Balmer series?
What are your calculated and your measure value of the Rydberg constant R in SI units (m-1) and what is the percent difference?
Are you satisfied with the results of your measurements? If yes, explain why, if no, suggest what could be done differently,